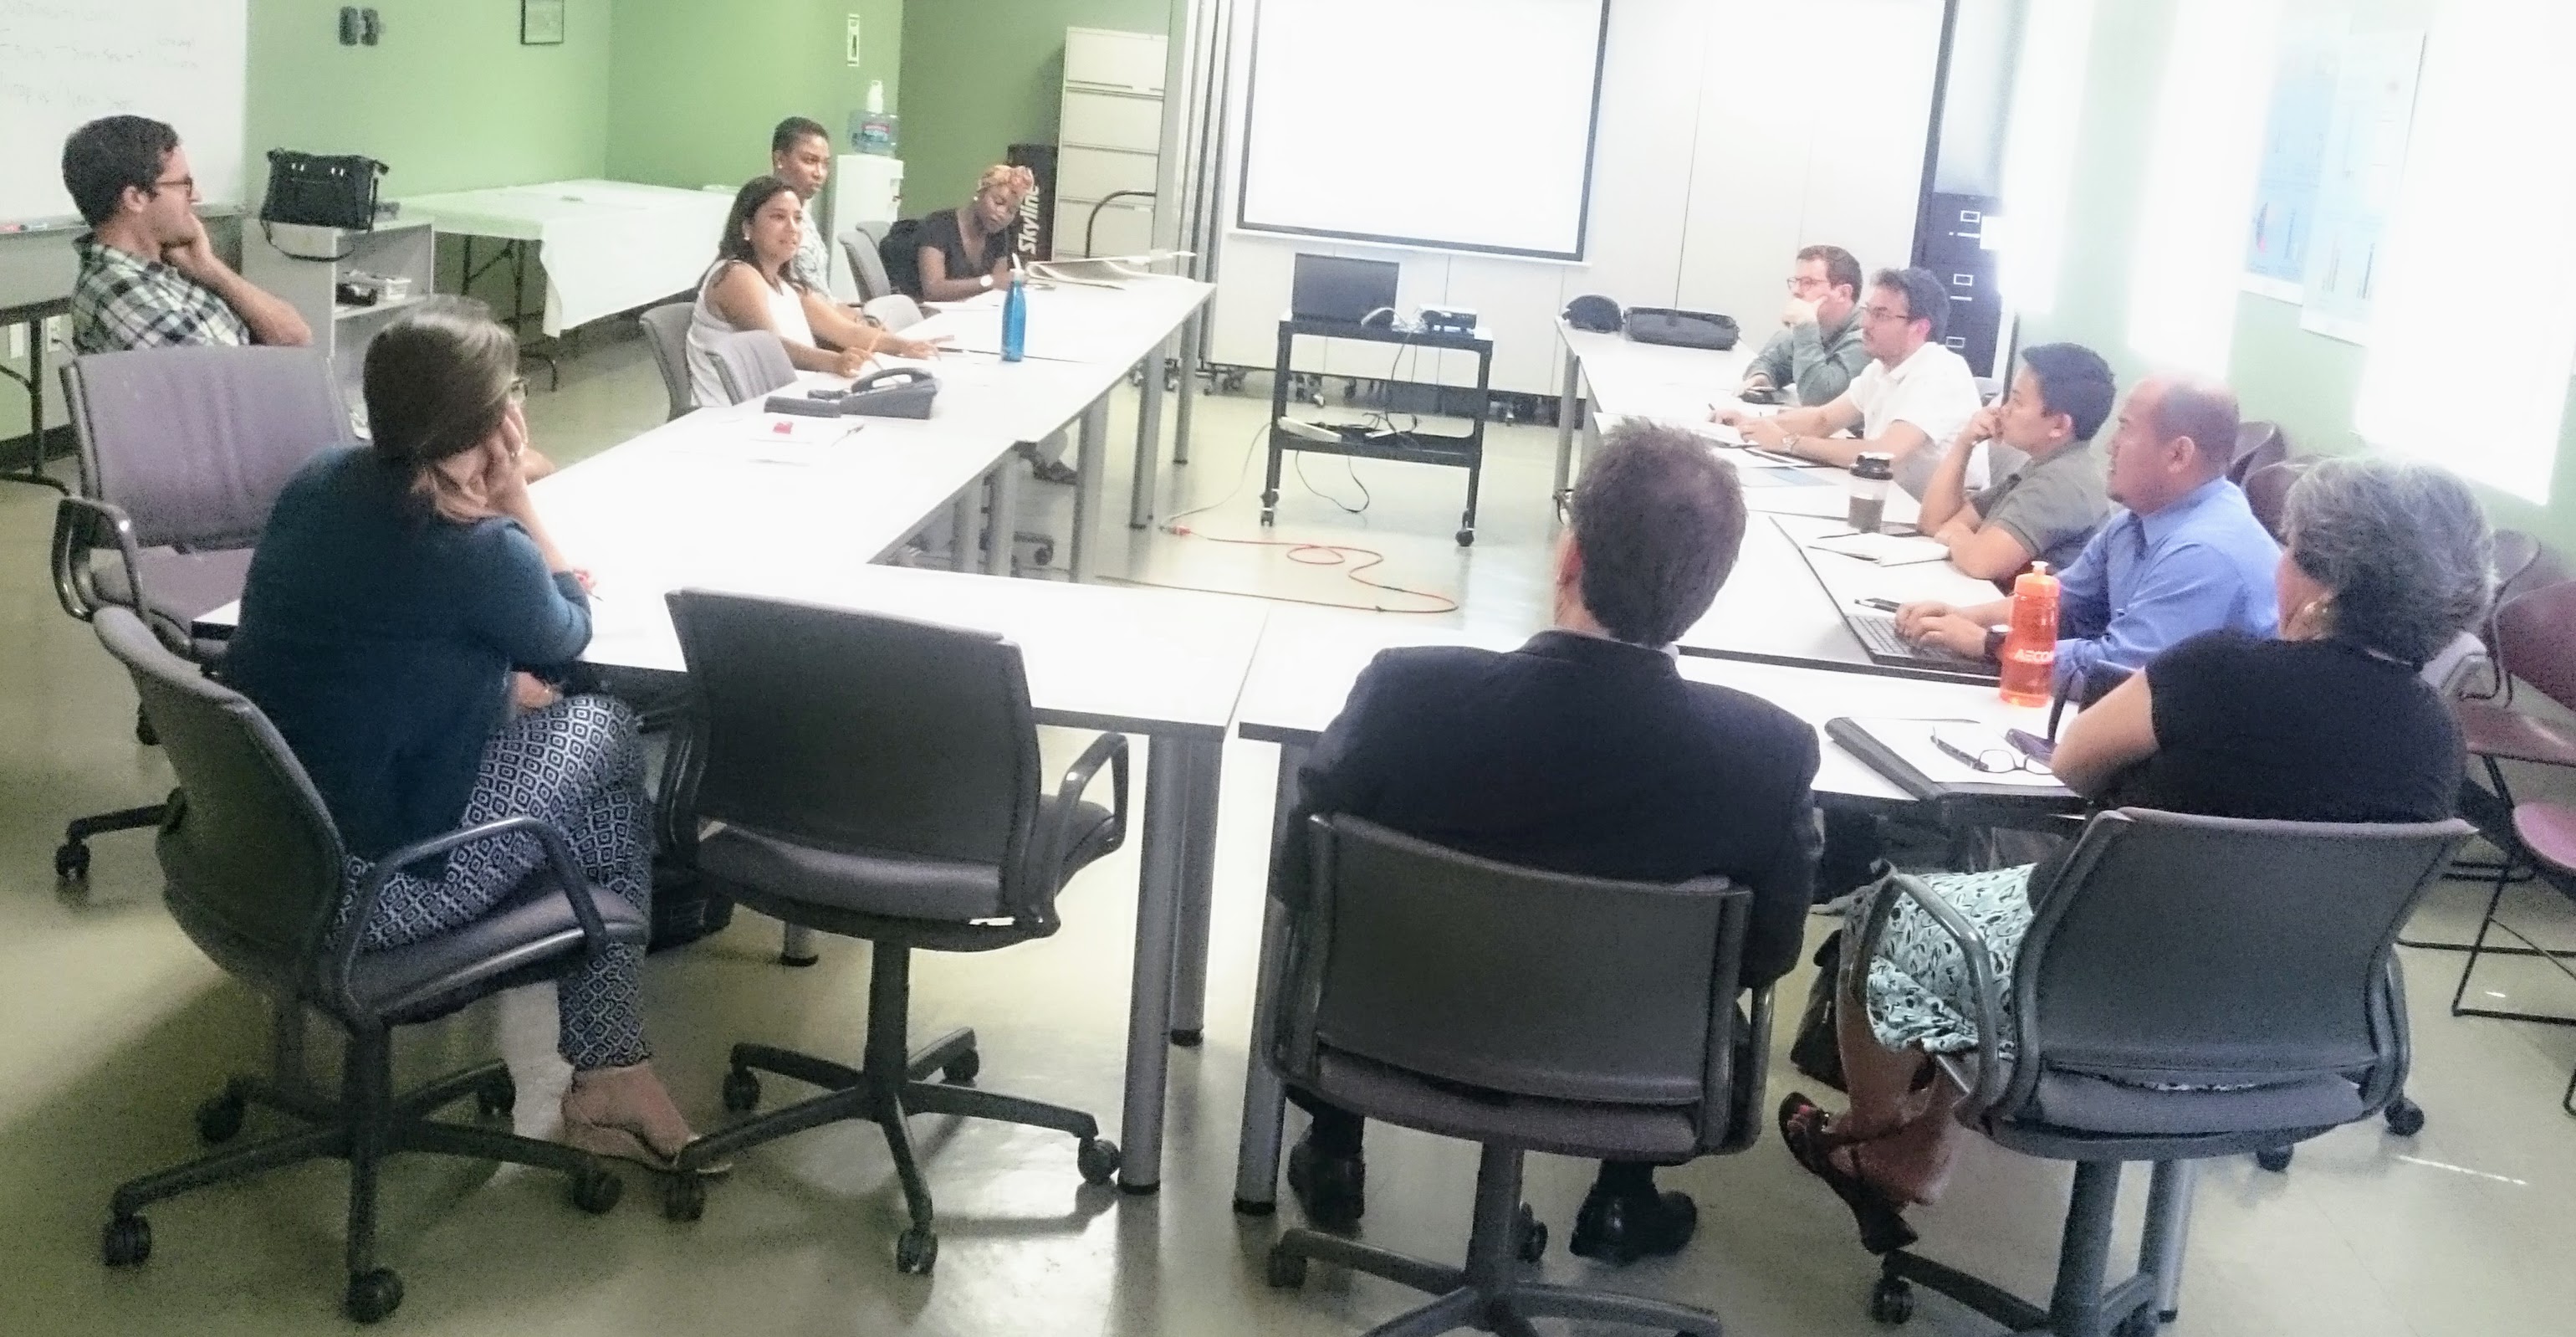
Last week, members of the EnviroMetro coalition came together to continue discussion on the development of an equity framework for Metro. This framework would guide the update of Metro’s Long Range Transportation Plan (LRTP) and the Measure M Administrative Procedures.
Metro continues to use a definition of equity that amounts to geographic equality – distributing equivalent resources to the various subregions in Los Angeles county based on solely population estimates. There is an abundance of research and data showing us that there are severe disparities in wealth, health outcomes, climate change burdens, and access to opportunities (jobs, education, housing, etc.) throughout the region. As Metro’s Planning Director, Therese McMillan, noted at the July Policy Advisory Council meeting, there are opportunity gaps around the county. These gaps or disparities are perpetuated by transportation investments, or lack thereof. Organizations within the EnviroMetro coalition have long advocated for Metro to adopt a definition of equity that takes into consideration these disparities. The LRTP update process is a key opportunity for Metro to define equity and create an equity framework for identifying areas of high need for transportation investments and prioritizing and evaluating Metro’s projects/programs accordingly. The LRTP is essentially a spending blueprint for Metro, a guide for how Metro will spend our transportation dollars, which includes revenues from Measures M and R, Propositions A and C, as well as state and federal dollars.
CalEnviroScreen (CES) is a statewide tool that has been used to define disadvantaged communities in the state’s cap-and-trade programs. Its indicators are related to pollution burdens and social vulnerabilities, and compares census-tracts statewide. Major critiques of this tool include its lack of an indicator for race/ethnicity, which cannot be included for legal reasons, and its statewide comparison of communities, which is not necessarily designed to guide local prioritization. However, Shankar Prasad of OEHHA showed us at our March coalition meeting that the underlying CES data can be applied on a regional level. Below are the CES statewide map and the map he created for us comparing only census tracts within L.A. county. Read more here.
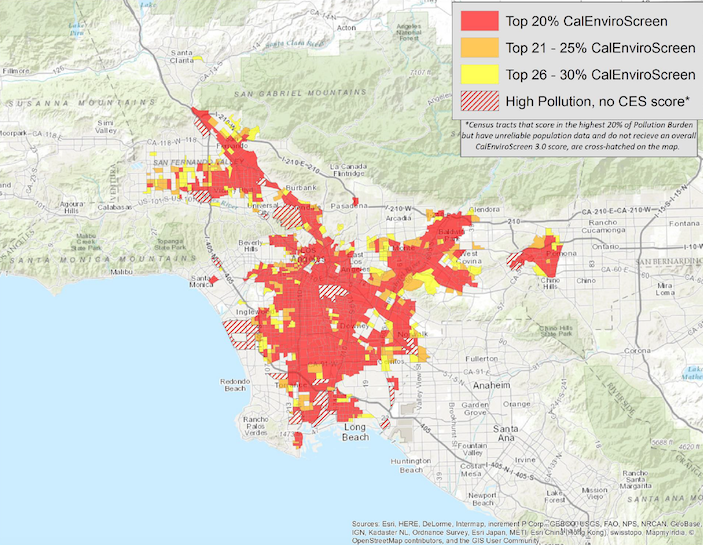
CalEnviroScreen 3.0 Statewide Comparison
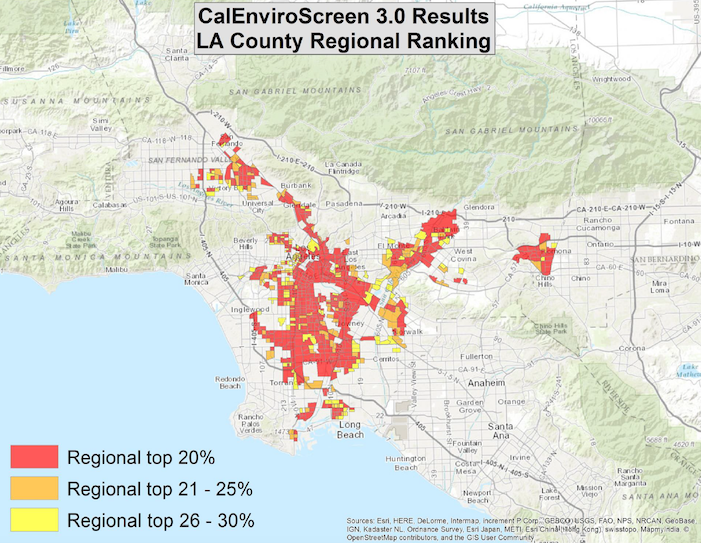
CalEnviroScreen 3.0 Countywide Comparison
USC’s Program for Environmental and Regional Equity (PERE) have recommended the creation of a transportation equity screening tool that compares communities on a regional level instead of statewide. Read more here.
Investing in Place’s Transportation Equity Technical Work Group has arrived at three equity indicators: race/ethnicity, household income, and vehicle ownership. They recommend that Metro use these indicators to identify communities for strategic transportation investments, which they refer to as Equity Opportunity Zones. Read more here.
The Trust for Public Land has released the Climate Smart Cities Los Angeles Decision Support Tool, which contains regional data on population characteristics, environmental factors, and mobility access. It can be used to map communities most vulnerable to climate change impacts and prioritize equitable decision-making. Read more here.
As a group, our goal was to build on these existing frameworks and the initial responses from our transportation priorities survey, in order to flesh out what other factors are important in defining transportation equity. Initial survey responses wanted to see a prioritization of investment in:
(1) bus infrastructure, particularly shade structures at stops,
(2) bus riders, Metro’s largest ridership group, and
(3) active transportation infrastructure.
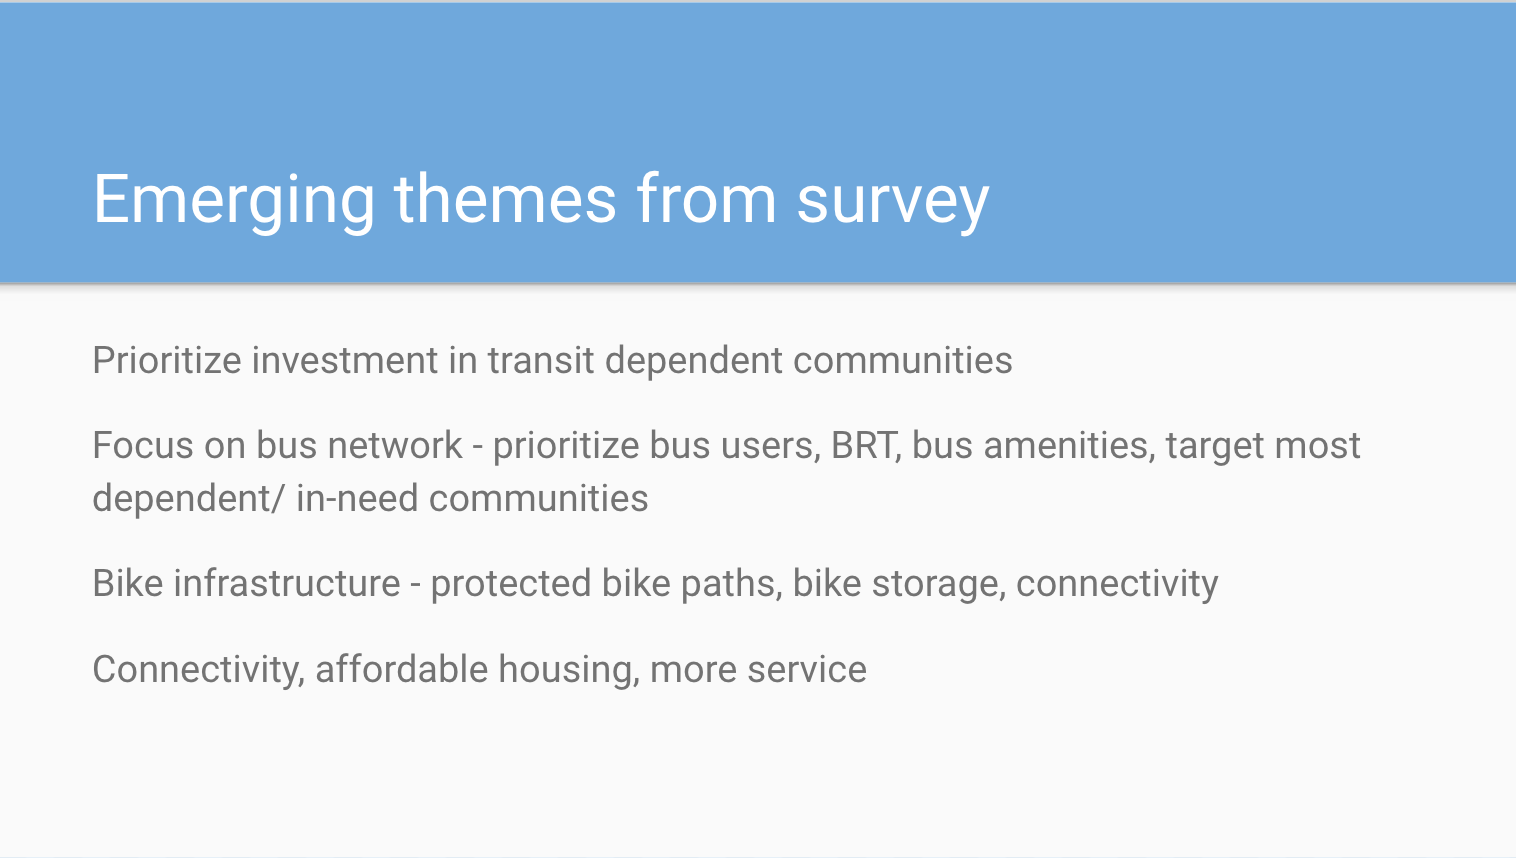
What issues do survey respondents want to see Metro focus on?
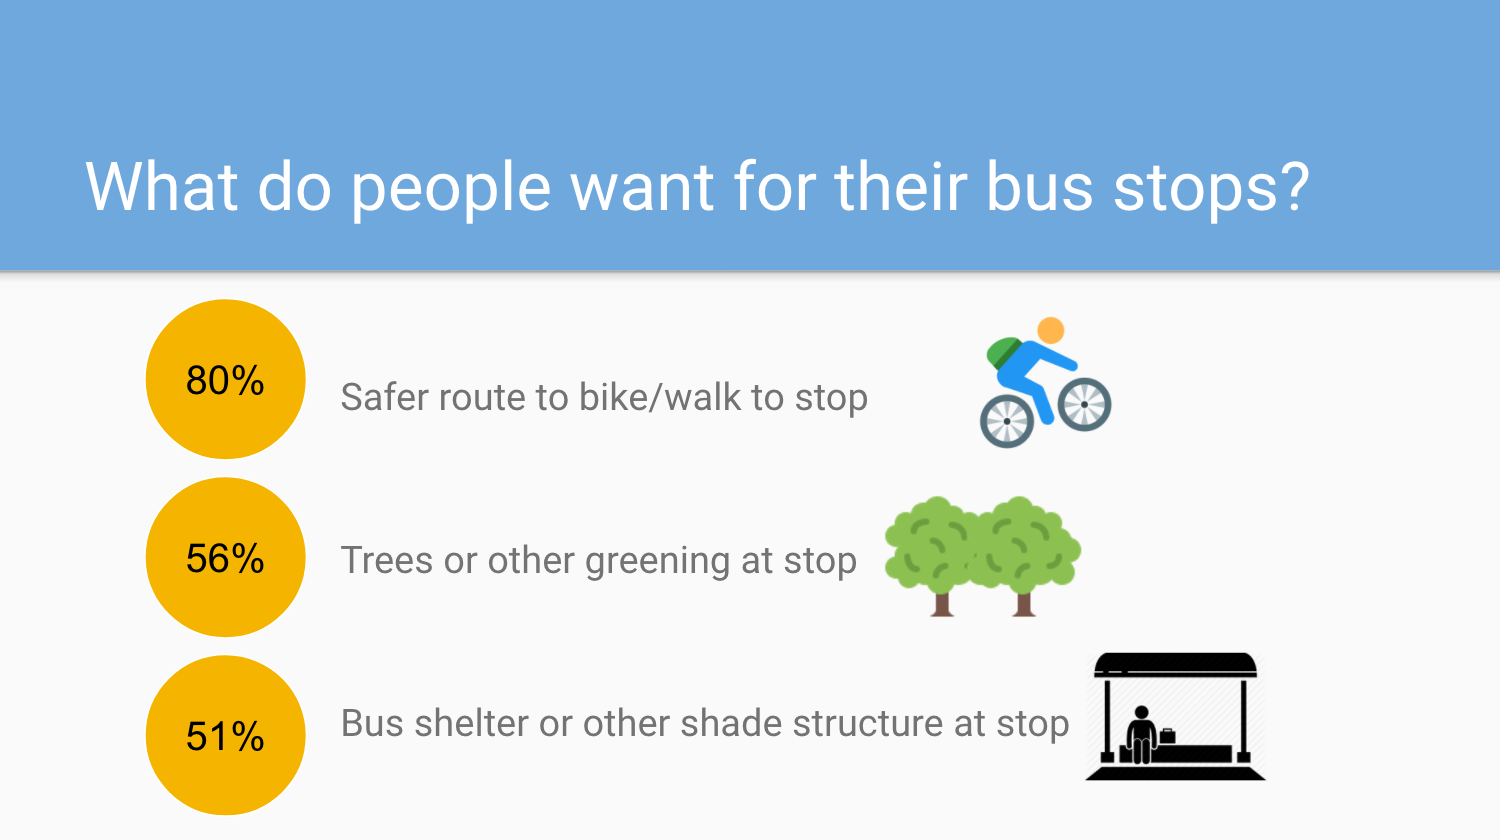
Initial Findings from EM Equity Priorities Survey
The EnviroMetro Steering Committee will build on these initial ideas to develop a white paper to present to Metro Policy Advisory Council. The paper will include recommendations for criteria / indicators to develop an equity definition and framework to guide Metro’s transportation investments. Our goal is to provide input early in Metro’s planning process and set the tone for how equity considerations will be integrated throughout.